Intuitive Classification
A visual explanation of neural networks.
Interactive demo.
This project is partly inspired by TensorFlow Playground

Background
I built this visualizer (interactive demo: here) when I first learned about neural networks. I was (still am) absolutely amazed by how neural networks learn to transform representation space and shift input distribution. After playing with TensorFlow Playground, I was a little perplexed as to how it works. (Backthen I don’t know much about machine learning in general). After some exploring and digging, I finally got some ideas in regards to what those visualizations mean. I felt that a more intuitive way would be to directly see how the representation space is shifted and transformed after passing through each layer. I didn’t find anything that can do this, so I built this visualizer with React, and TensorFlow.js. Code is available here.
Basic Usage

This visualizer is pretty self-explanatory.
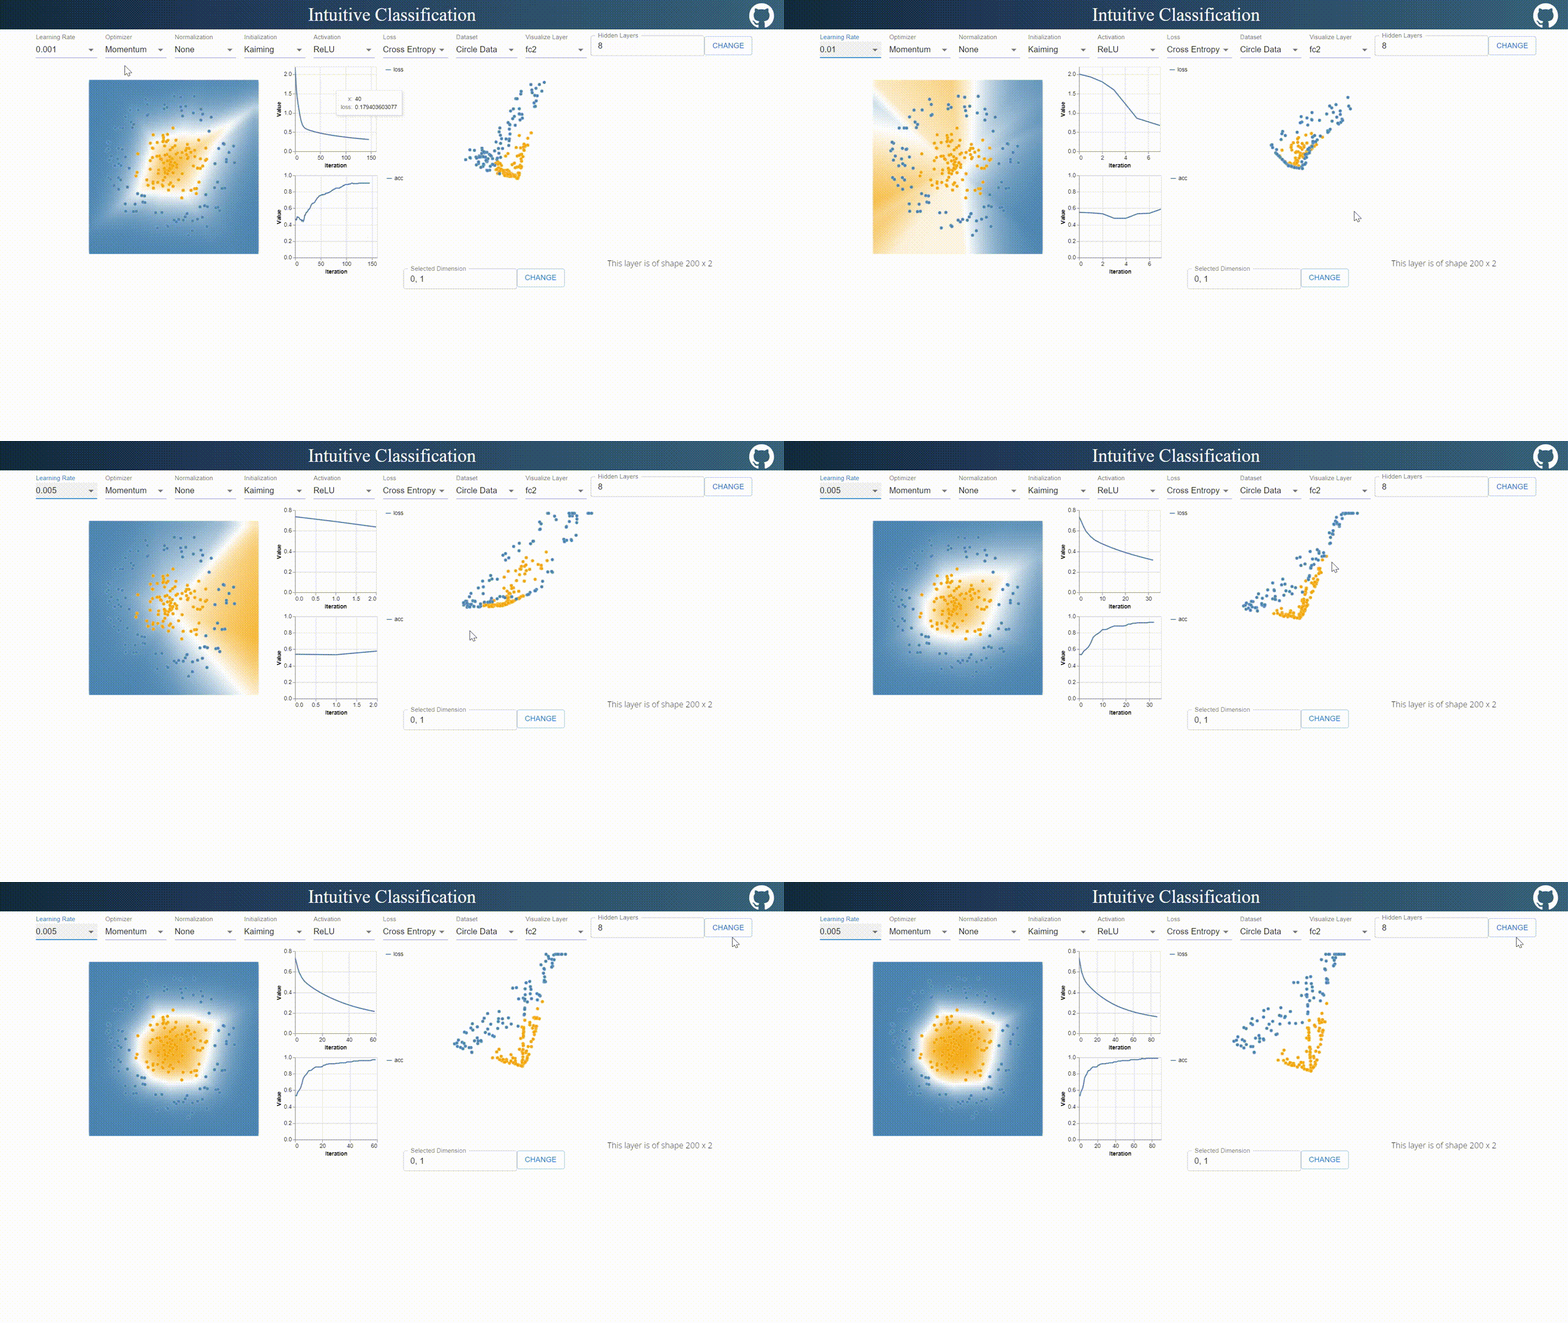
On the navigation bar, I designed an interface for tuning hyper-parameters. Compared to TensorFlow Playground, I added a few more options such as optimizer, normalization methods, initialization methods and layer visualization options.
On the top right, users are allowed to define arbitrary number of layers with arbitrary number of neurons with arbitrary number of layers.
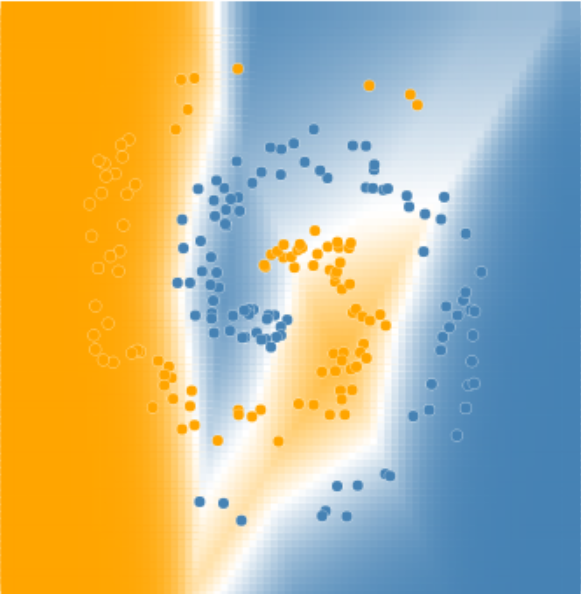
The visualization on the left updates decision boundary in real time, while the right visualization updates the output in the selected 2 dimensional space.


Interesting Properties
1. LayerNorm can act as a non-linear layer.
LayerNorm shifts and rescales input distribution per element, which introduces non-linearality. In the section, I try using intuitive visualization to demonstrate this.
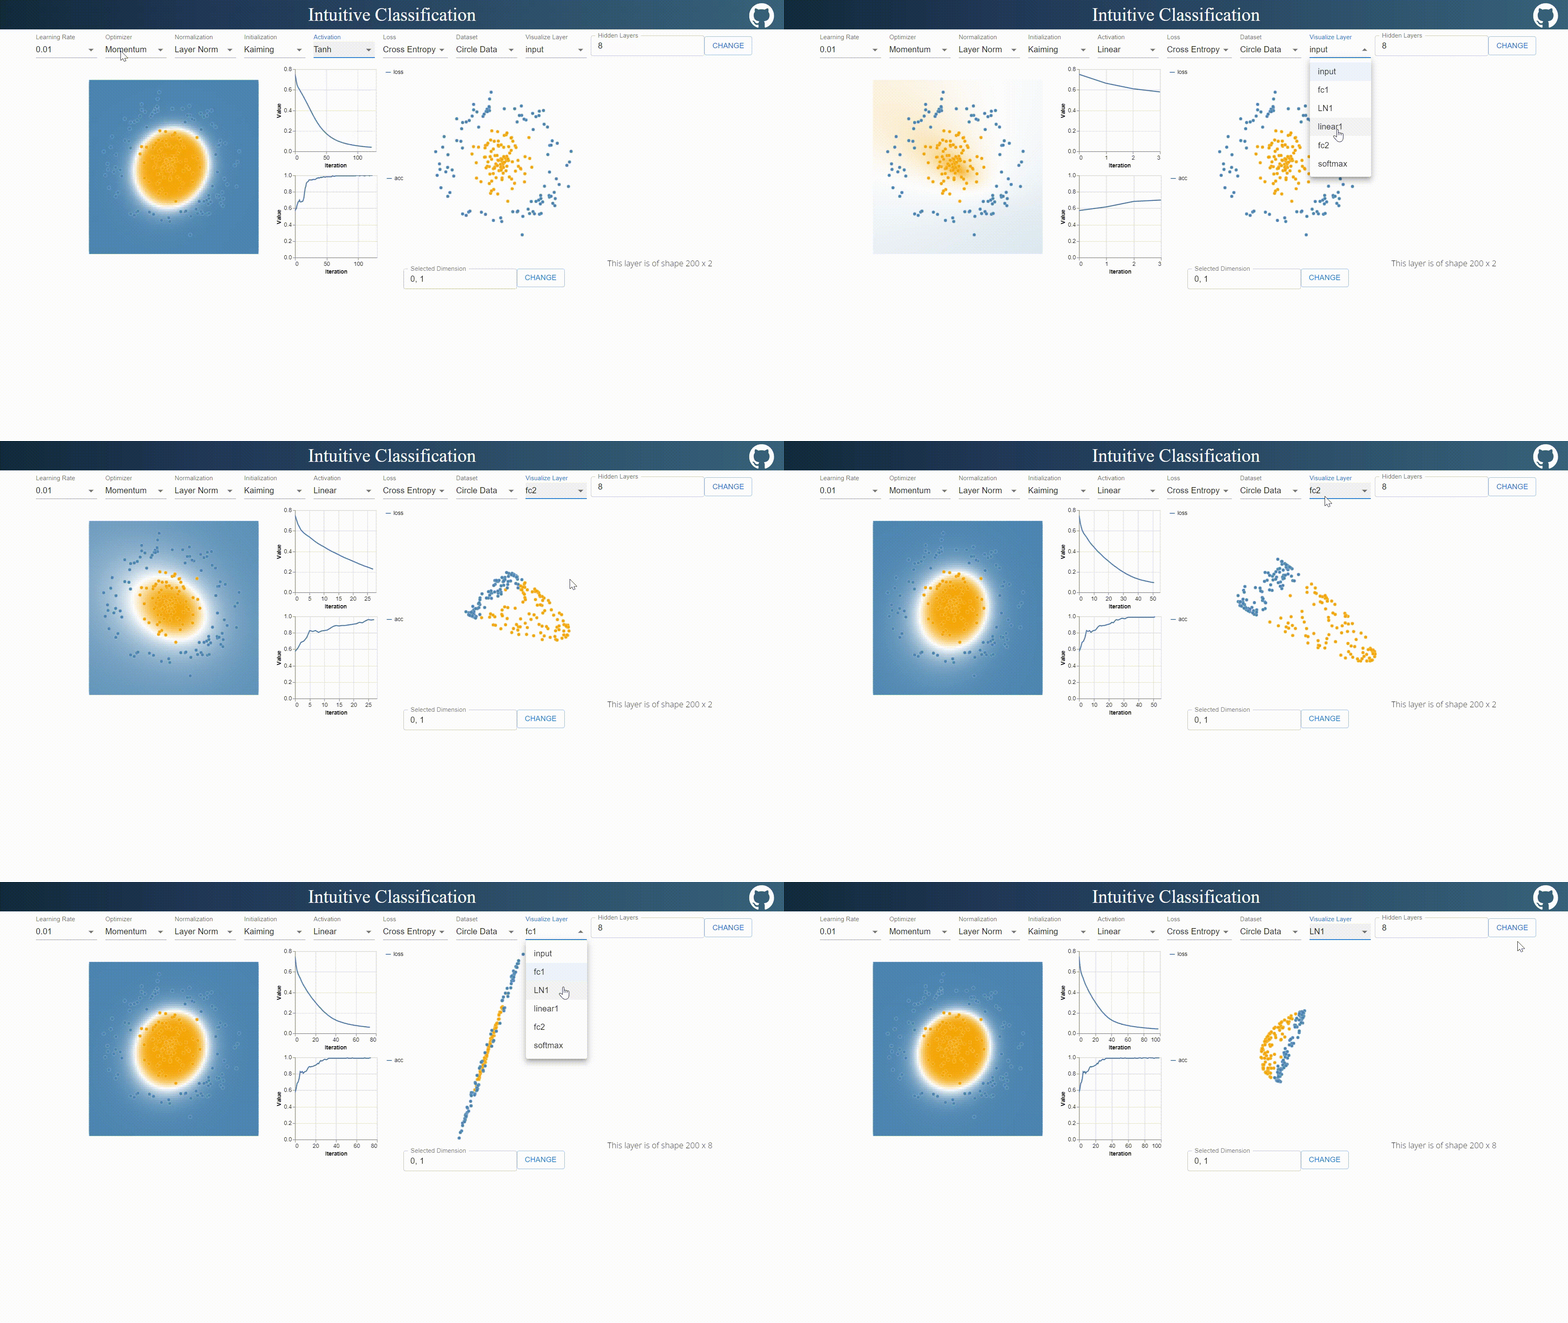
LayerNorm exhibits non-linearality

After setting the activation function to “Linear” (identity function in my implementation), all other layers except softmax can only shift and rescale input distribution. However, LayerNorm was able to “extract” the orange dots, and transform distribution in such a way that it became linear separable for later layers.
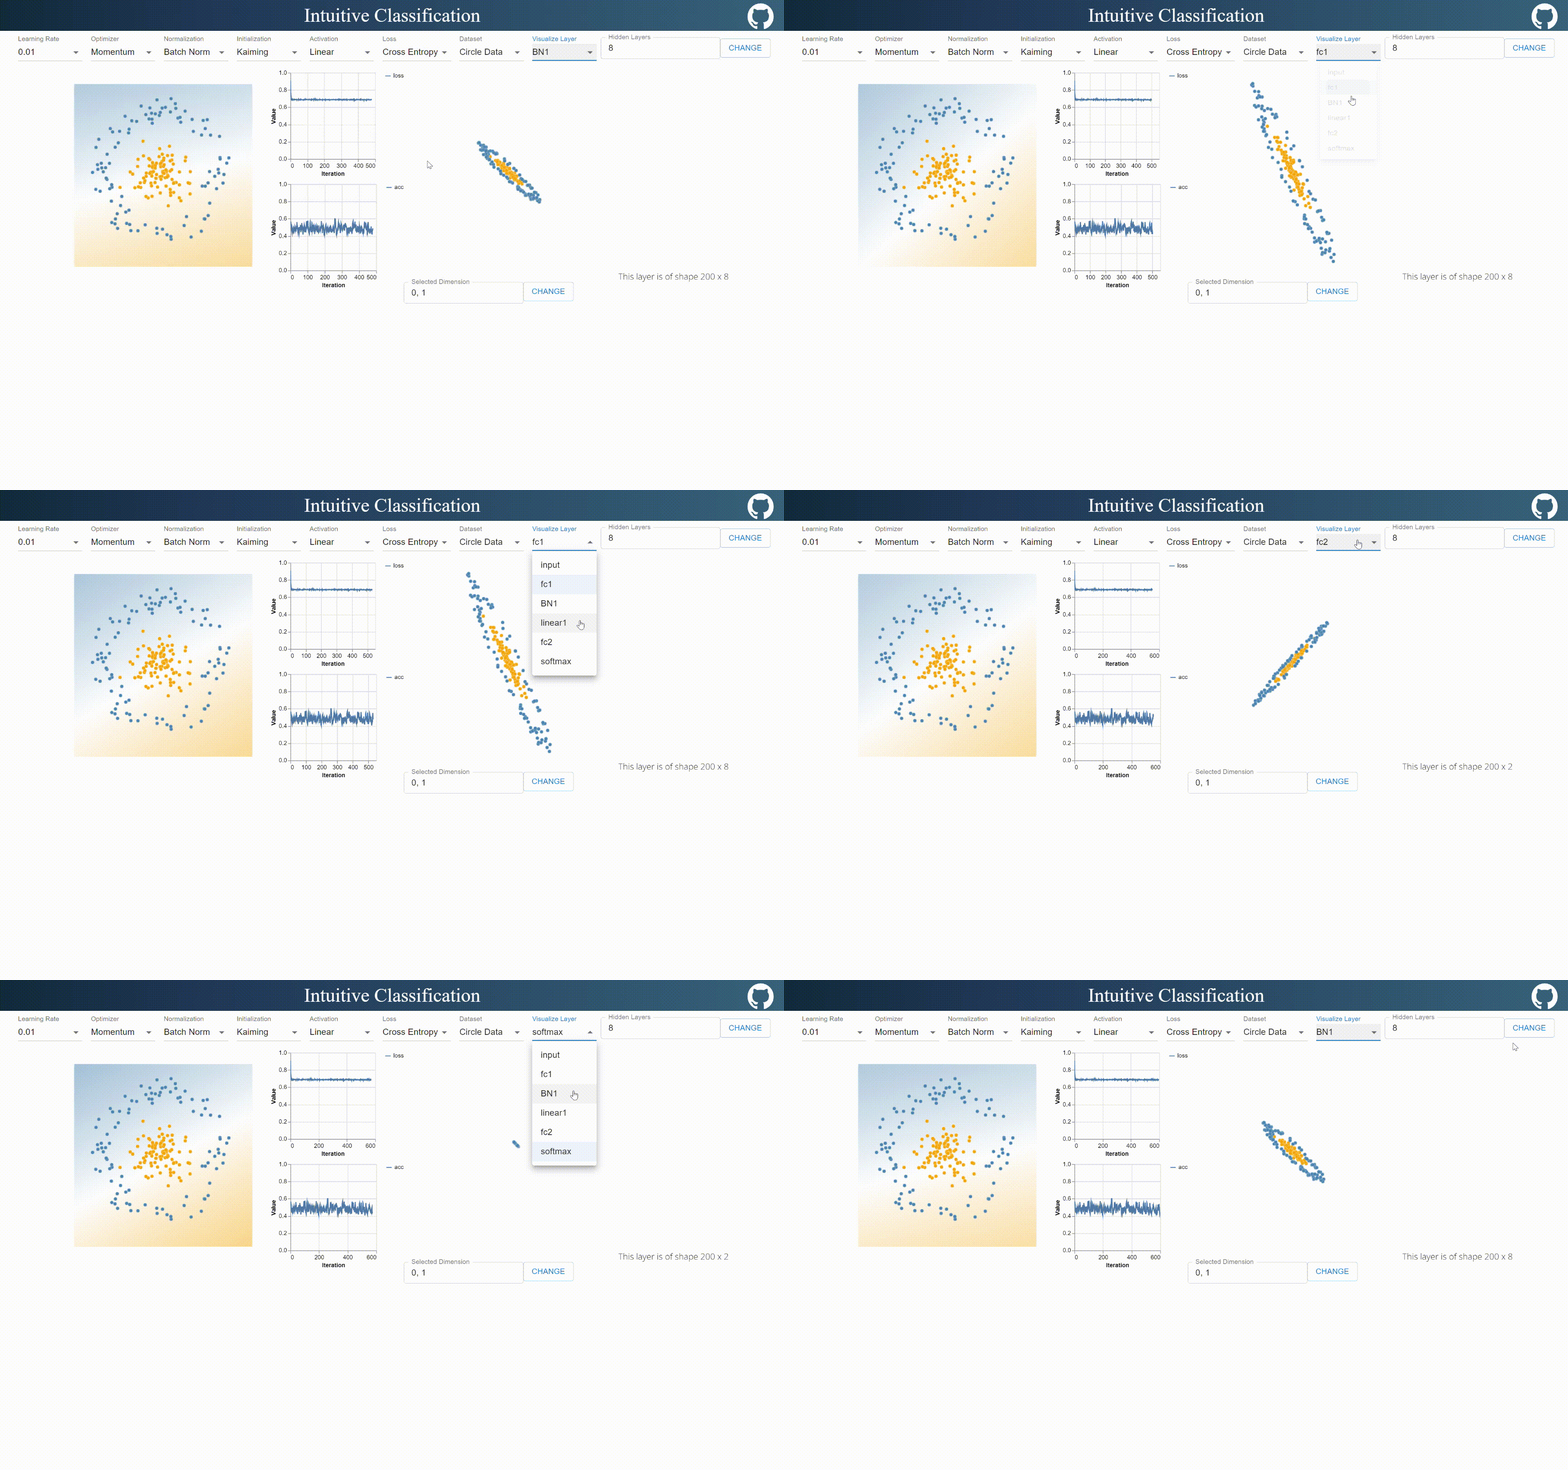
BatchNorm is linear

BatchNorm can only shift and rescale input distribution uniformly, it does not hold visible non-linearality. I think it’s because mean and variance are handled unanimously across batch, while layernorm handles mean and variance per element, which introduces non-linear properties.